Advanced View Builder logic within the App Designer allows you to make your views more dynamic, responding to the participant or other data. For example, you might want to display a participant field (show their gestational week), use an expression in your view (show first name only if captured), or add a visualization of a step goal to a daily step graph.
Piping
- Display that information back to the participant
- Dynamically hide or show content
- Perform mathematical operations, e.g., to calculate a score
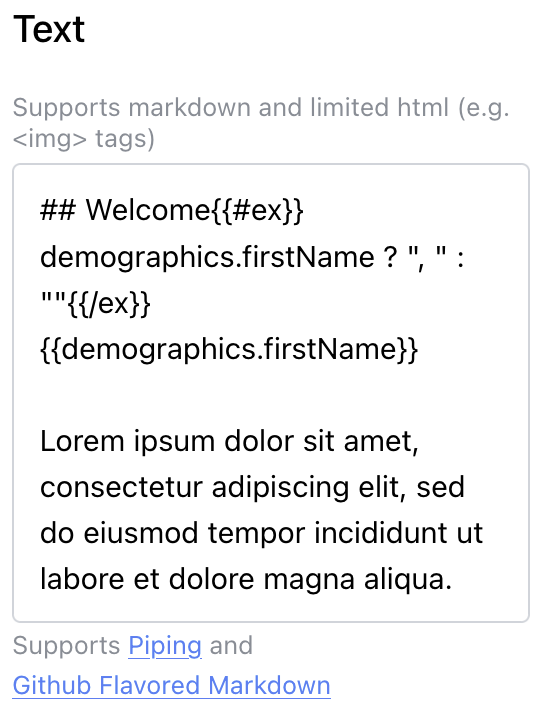
If a component supports piping, you’ll find a “Supports Piping” detail text below the applicable fields. Following the “Supports Piping” link will open a pop-up with the below details about how to use piping.
[details]
[summary]Syntax[/summary]
The MyDataHelps View Builder supports mustache.js syntax for piping participant, project, or device fields in all text fields. For example, to insert the participant's first name, you can use:
Welcome, {{demographics.firstName}}
You can also hide or show blocks of text based on the presence or absence of certain fields. For example, if the participant has not yet recorded their name, you may want to just address them as "Participant":
Welcome, {{#demographics.firstName}}{{demographics.firstName}}{{/demographics.firstName}}{{^demographics.firstName}}Participant{{/demographics.firstName}}
Available Fields
| Field | Description | Example Usage |
participantIdentifier |
Project-specific participant identifier. |
{{participantIdentifier}}
|
participantID |
Auto-generated internal ID for the participant. |
{{participantID}}
|
projectID |
The project identifier. |
{{projectID}}
|
enrollmentDate |
Date when the participant completed enrollment, in ISO8601 format. |
{{enrollmentDate}}
|
demographics |
Object containing properties for all demographic fields populated for the participant. Unpopulated values are not included. |
{{demographics.email}}
{{demographics.mobilePhone}}
{{demographics.firstName}}
{{demographics.lastName}}
{{demographics.street1}}
{{demographics.street2}}
{{demographics.city}}
{{demographics.state}}
{{demographics.postalCode}}
{{demographics.dateOfBirth}}
{{demographics.preferredLanguage}}
{{demographics.gender}}
{{demographics.utcOffset}}
|
customFields |
Object whose properties represent key/value pairs as project-specific custom fields. | {{customFields.MyProjectCustomField}} {{customFields.SurgeryDate}} |
project |
Information about the project, e.g. the title and support information |
{{project.id}}
{{project.name}}
{{project.description}}
{{project.type}}
{{project.code}}
{{project.supportEmail}}
{{project.supportPhone}}
{{project.learnMoreLink}}
{{project.learnMoreTitle}}
{{project.organization}}
{{project.platforms}}
|
device |
Information about the device the participant is using |
{{device.identifier}}
{{device.platform}}
{{device.properties}}
|
currentLanguage |
The locale code for the language being used to access the view. |
{{currentLanguage}}
|
Notice that the syntax for demographic and custom fields is different within the View Builder (e.g., customFields.SurgeryDate) as opposed to how you might use it in a survey, notification, or expression (e.g., CustomField.SurgeryDate).
[/details]
[details]
[summary]Expressions[/summary]
Not to be confused with Expressions in MyDataHelps Designer, you may also use View Builder Expressions to make conditional checks or perform calculations. These can be used in 2 places — in text fields or in conditional components.
In any text field, you may embed expressions inside an {{#ex}}my expression here{{/ex}}, for instance:
Your score today is: {{#ex}}customFields.MoodScore * customFields.SleepScore / 20{{/ex}}
or
Welcome{{#ex}}demographicFields.firstName ? demographicFields.firstName : " Participant"{{/ex}}
Conditional components also use expressions. You can add a conditional component by opening "Basic Building Blocks" and dragging it into your view. For example, to show content if the participant's recent mood score was less than 5, you could use the expression:
customFields.MoodScore < 5
Or show a component if the participant is using an iOS device:
device.platform == "iOS"
[/details]
[details]
[summary]Javascript Functions[/summary]
now
{{#ex}}format(now, "MM/dd/yyyy hh:mm:ss"){{/ex}}
equal
{{#ex}}equal(customFields.Goal, customFields.PointsEarned){{/ex}}
unequal
{{#ex}}unequal(customFields.Goal, customFields.PointsEarned){{/ex}}
[/details]
[details]
[summary]Date Expressions[/summary]
The following date expressions are backed using date-fns. See https://date-fns.org for details.
format
{{#ex}}format(now, "MM/dd/yyyy hh:mm:ss"){{/ex}}
formatDistance
{{#ex}}formatDistance(enrollmentDate, customFields.SurgeryDate){{/ex}}
formatDistanceToNow
{{#ex}}formatDistanceToNow(enrollmentDate){{/ex}}
differenceInMinutes
{{#ex}}differenceInMinutes(enrollmentDate, customFields.SurgeryDate){{/ex}}
differenceInHours
{{#ex}}differenceInHours(enrollmentDate, customFields.SurgeryDate){{/ex}}
differenceInDays
{{#ex}}differenceInDays(enrollmentDate, customFields.SurgeryDate){{/ex}}
differenceInCalendarDays
{{#ex}}differenceInCalendarDays(enrollmentDate, customFields.SurgeryDate){{/ex}}
differenceInWeeks
{{#ex}}differenceInWeeks(enrollmentDate, customFields.SurgeryDate){{/ex}}
differenceInCalendarWeeks
{{#ex}}differenceInCalendarWeeks(enrollmentDate, customFields.SurgeryDate){{/ex}}
differenceInMonths
{{#ex}}differenceInMonths(enrollmentDate, customFields.SurgeryDate){{/ex}}
differenceInCalendarMonths
{{#ex}}differenceInCalendarMonths(enrollmentDate, customFields.SurgeryDate){{/ex}}
[/details]
Conditionals
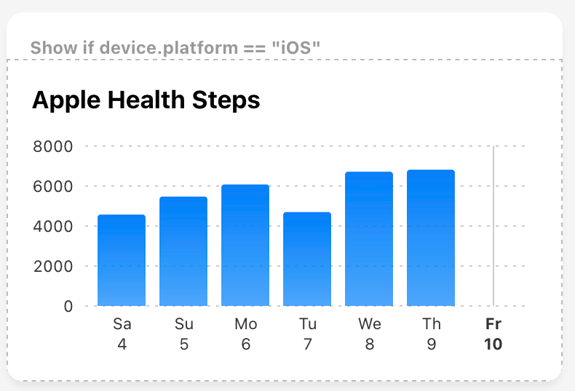
Most often, you'll want to use piping expression (see above) within a conditional component. This allows you to hide or show the components nested within the conditional if the expression evaluates as true, for example, showing a graph of Apple Health steps if they are on iOS:
device.platform =="iOS"

You can also use AND and OR logic with your conditionals, evaluating for more than one expression. The below example shows 3 different expressions being evaluated:
or(customFields.ComponentSymptomShark == "True", or(customFields.ComponentDeviceData == "True", customFields.ComponentEHRData == "True"))

When using AND or OR, you can only evaluate two expressions, separated by a comma. If you need to evaluate more expressions, you'll need to nest them within one another like in the above example.
Date Range Coordinator
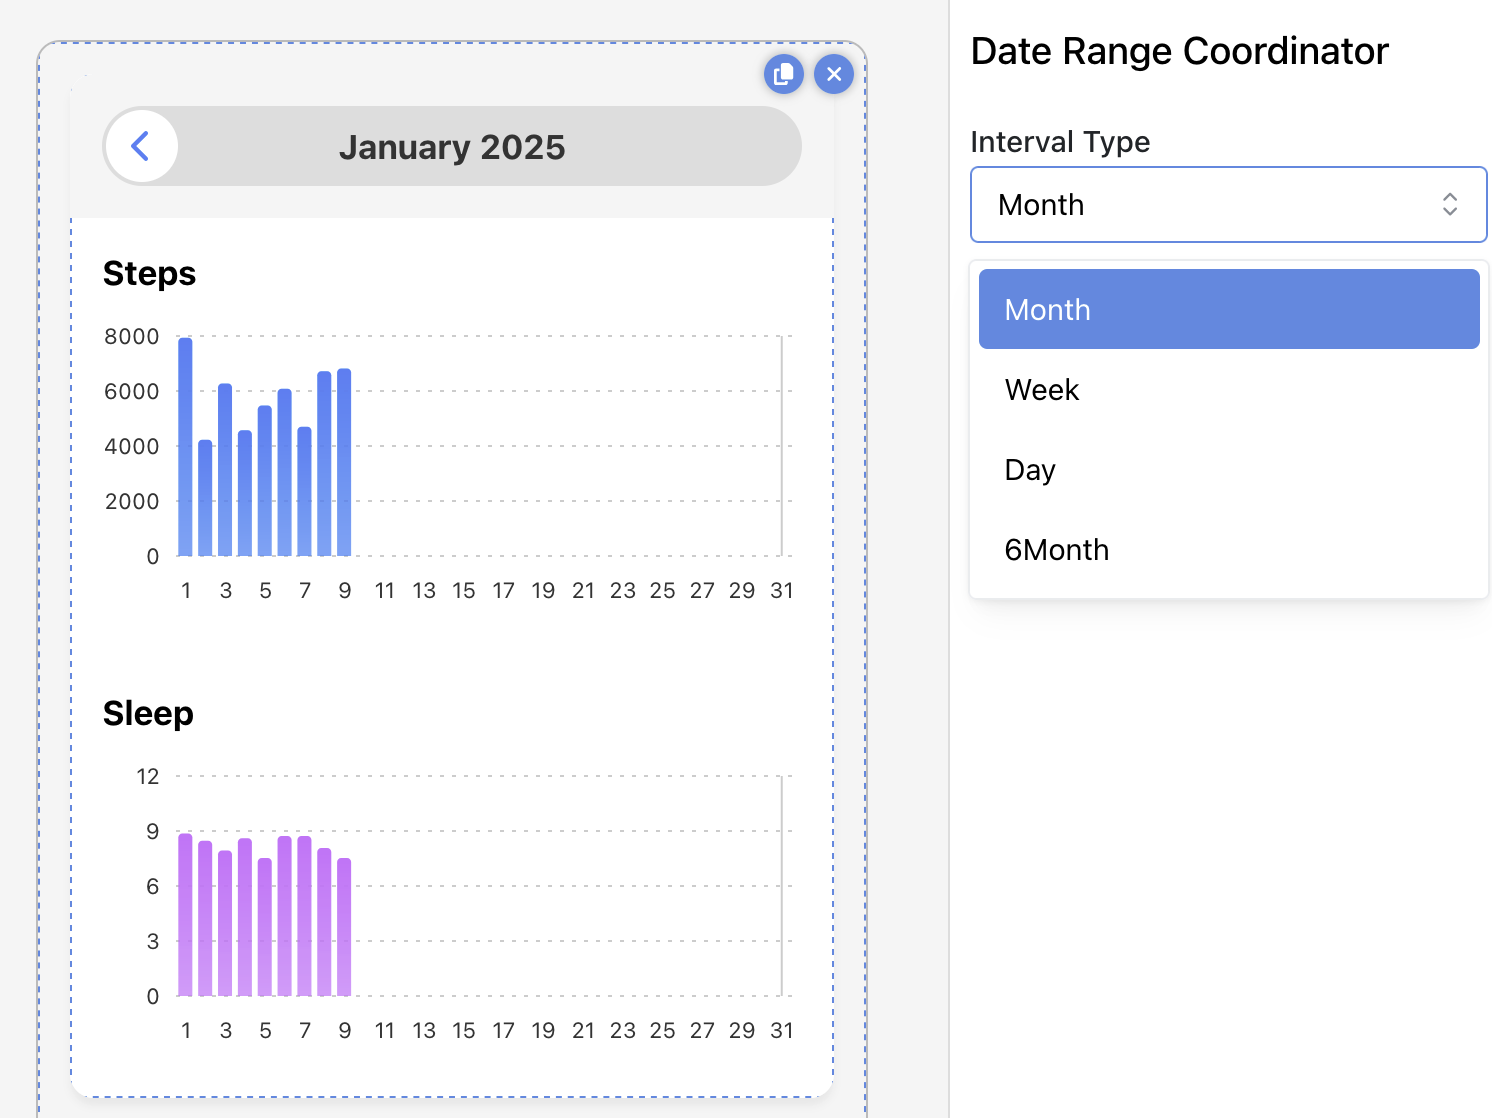
A date range coordinator is an easy way to allow participants to navigate through their past data, potentially adjusting multiple components at once.
In the below example, participants can use the back arrow by the month and year to view their Steps and Sleep from prior months. If you change the coordinator to use a week interval type, participants will only see data for the past week and the back arrow will navigate back one week at a time.
Thresholds for Data Visualizations
Thresholds make data charts much more engaging. For example, in a daily data chart, if a daily value is above the threshold, it can change color. This is a great way to visually indicate goals or upper limits for health data. You can also add a reference line which will show where the threshold is. While the below example uses "7000" as the threshold value, the threshold value supports piping and most projects will instead want to use a custom field (e.g., customFields.StepGoal) which can then be personalized to the participant.
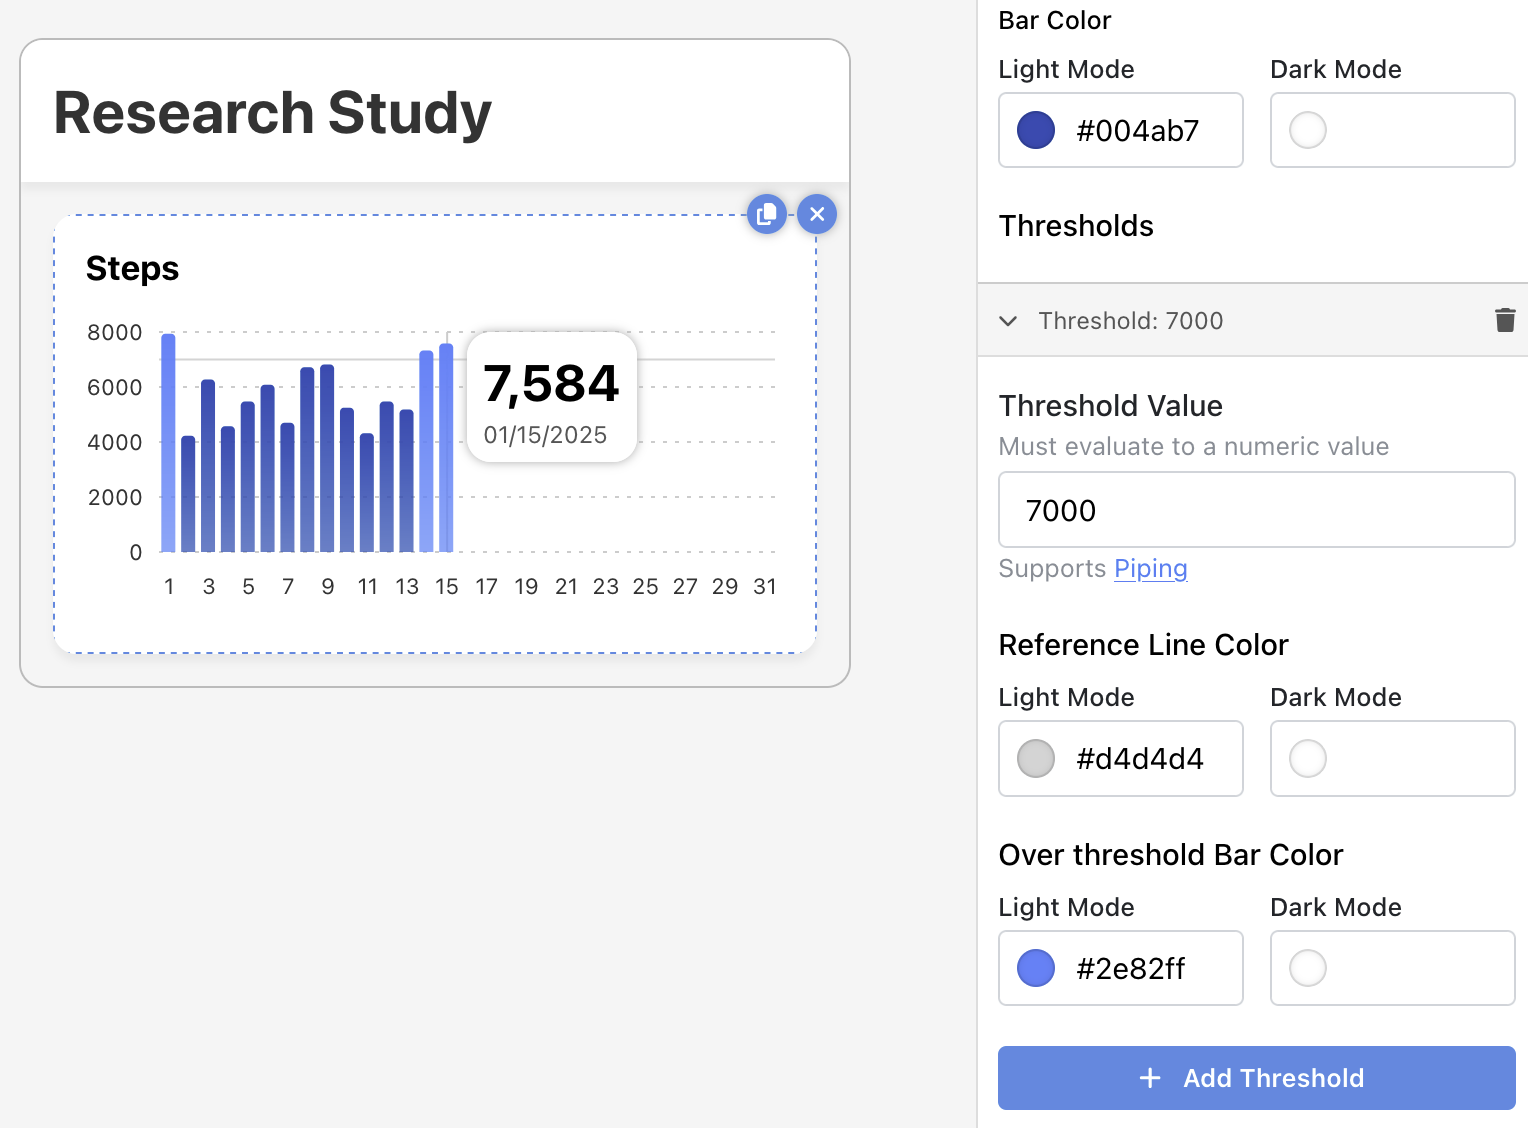
For certain data types, you might want more than a single threshold, perhaps encouraging participants to be over one threshold and under another. Play around with the threshold colors to make sure the visualization effectively communicates the message you want participants to receive.
Thresholds are available for the Relative Activity and Daily Data Chart components.