This article captures all of the View Builder's components within the App Designer. Notably, most components can further be modified by placing them into your view, selecting them, and adjusting the component settings on the right.
Basic Building Blocks
| Component | Description | Example |
| Card | Group elements together in a box with rounded corners and outer margin. |
|
| Section | Group elements together in a box with no left/right margin. |
|
| Button | Performs an Action (see below) when selected. |  |
| Action |
Performs an action when selected. One of the more common component types used. Action options include:
|
|
| Text | Supports markdown | |
| Graphic | Image or icon |  |
| Progress Bar | Supports piping for numerator and denominator | 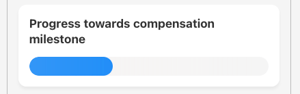 |
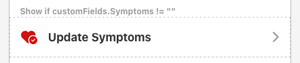
| Conditional |
Show/hide content based on participant information. Note: You can use `and` or `or` to evaluate two statements within a single conditional component. |
 |
| Grid | Lay elements out horizontally | 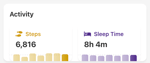 |
| Date Range Coordinator | Allows paging through dates for date-based components. | 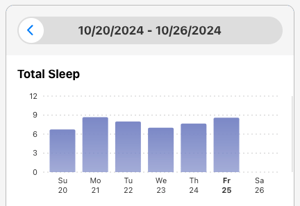 |
| Date Range Title | Displays title of current date range inside a date range coordinator | 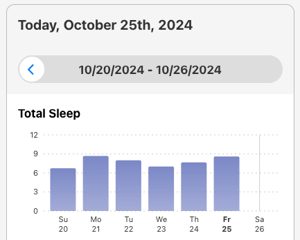 |
| Rotating Component Coordinator | Renders a single child (component) at a time based on an interval. |
|


Surveys
| Component | Description | Example |
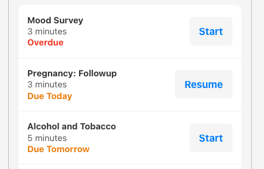
| Survey Task List | Dynamic list of complete/incomplete survey tasks |
|
| Inbox Item List Coordinator | A coordinator that allows for synchronization of Inbox Item Lists. | N/A |
| Inbox Item List | A configurable list of Inbox items | 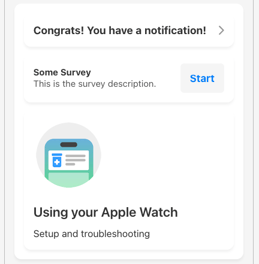 |
Notifications
| Component | Description | Example |
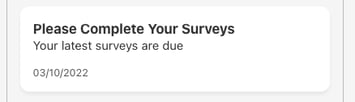
| Most Recent Notification |
Displays the most recent notification |
|
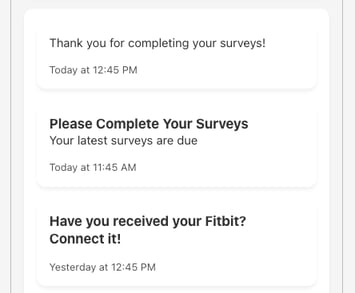
| Notification List | List of notifications |
|
Electronic Health Records
| Component | Description | Example |
| Connect EHR | Prompts the user to connect to their electronic health records. | 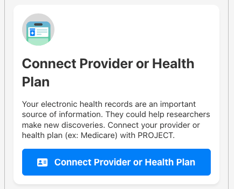 |
| Provider Search | Search interface for a participant to connect their provider or health plan. | 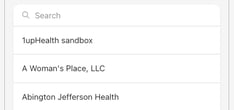 |
| View EHR | Links the user to the Health & Wellness Dashboard if they have an EHR connected. | 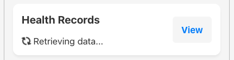 |
| Apple Health Records Sync | Facilitates having a participant connect to their Apple Health Records. |  |
| Lab Results Preview | Preview list of lab results in EHR data. Links to full lab history. | 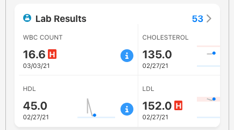 |
| Blood Type | Display Blood Type if present. Links to Medline info. | 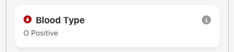 |
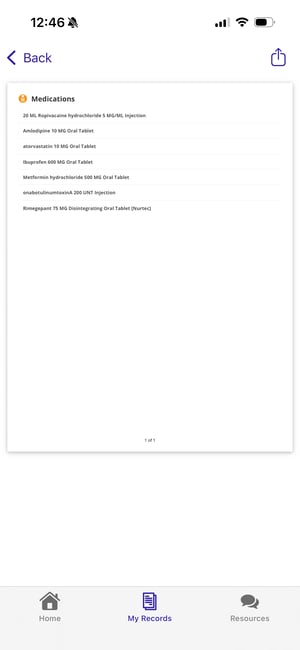
| Medications Preview | Preview list of medications in EHR data. Links to full medication list. | 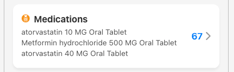 |
| Allergies Preview | Preview list of allergies in EHR data. Links to full allergies list. | 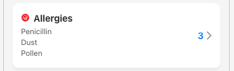 |
| Immunizations Preview | Preview list of immunizations in EHR data. Links to full immunization history. | 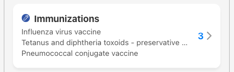 |
| Reports Preview | Preview list of reports in EHR data. Links to full report history. | 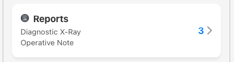 |
| Conditions Preview | Preview list of conditions in EHR data. Links to full condition list. | 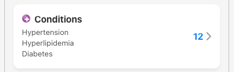 |
| Procedures Preview | Preview list of procedures in EHR data. Links to full procedure history. | 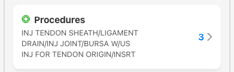 |
If a participant clicks into one of the Preview components, they can click the download button in the top right to obtain a PDF of the data that can then be shared.

Devices / Wearables
| Component | Description | Example |
| Connect Devices Menu | A menu of all device connections available for the participant to select. | 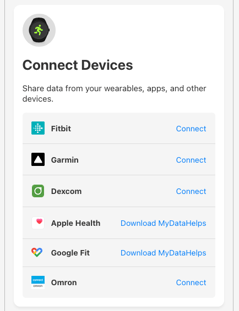 |
| Connect Dexcom | Prompts the user to connect their Dexcom. |  |
| Connect Fitbit | Prompts the user to connect their Fitbit. |  |
| Connect Garmin | Prompts the user to connect their Garmin. |  |
| Connect Oura | Prompts the user to connect their Oura. |  |
| Fitbit Devices | Displays the list of connected Fitbit devices. | 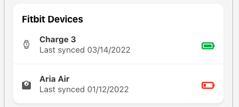 |
| Garmin Devices | Displays the list of connected Garmin devices. | 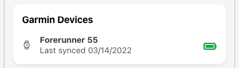 |
| View Device Activity | Links the user to the standard device activity dashboard if they have a device connected. |  |
Files & Documents
| Component | Description | Example |
| Uploaded File Action | An action that opens an uploaded file. |  |
| Document Library Preview | Preview list of uploaded documents. Links to full document library. |  |
Account
| Component | Description | Example |
| App Download Prompt | Prompts the user to download the app if they are using a web browser. | 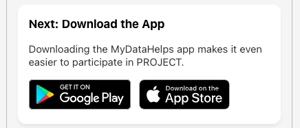 |
| External Accounts Loading Indicator | Displays a loading indicator while data from external accounts (e.g., Fitbit or EHR) is retrieved | |
| External Accounts Preview | List of external accounts the user has connected. Opens the full list when connected. | 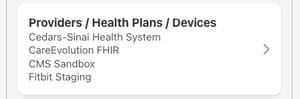 |
Data Visualization
| Component | Description | Example |
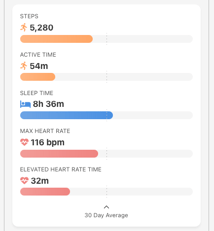
| Micro Trend | Displays activity relative to thresholds or 30 day average for single data type |  |
| Relative Activity | Displays activity relative to thresholds or 30 day average | 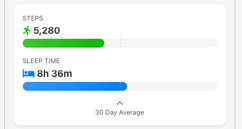 |
| Relative Activity Day Coordinator | Day navigation view that shows relative activity | 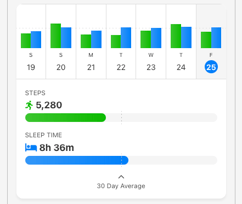 |
| Daily Data Chart | Week / month chart of daily data | 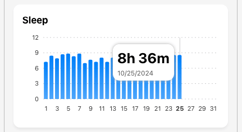 |
| Daily Data Goal | Displays progress against a goal |  |
| Blood Pressure | Configure against sensor and/or survey data to visualize Blood Pressure. | 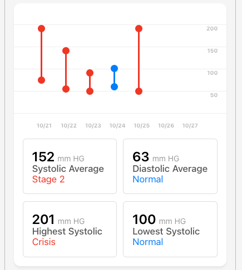 |
| Latest Blood Pressure Reading | Displays the participant's most recent blood pressure reading. |  |
| Severity Calendar | Configure against survey data to show self-reported severity data. | 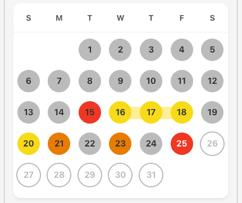 |
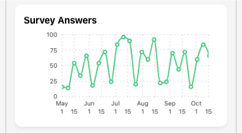
| Survey Answer Chart |
Week / month chart of numerical survey responses. Optionally, you can use the survey's event date instead of the survey completion date by checking Use Event As Date. |
 |
| Goal | Displays progress toward a goal. |  |
| Insight Matrix |
Compares values from multiple daily data types in tabular format. Optionally, you can use the survey's event date instead of the survey completion date by checking Use Event as Date. |
 |
| Intraday Heart Rate Chart | Shows the heart rate for the selected day. |  |
Engagement
| Component | Description | Example |
| Points for Badges | Displays badges earned for activities |  |
Project
| Component | Description | Example |
| Project Header | Displays the logo, name, and organization/workspace name for the project. |  |
| Project Support | Displays support information (e.g., learn more link, email, phone) for the project. |  |
Symptom Shark
Please also refer to the Symptom Shark article.
| Component | Description | Example |
| Log Today | Displays the current day's symptom log or prompts the user to complete it. | 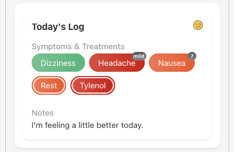 |
| Log Entry List | Infinite scrolling list of past log entries | 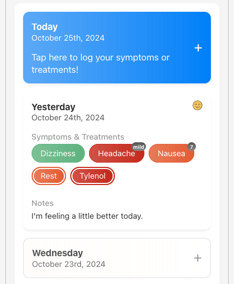 |
| Visualization Coordinator | Provides data and context for calendar, histogram, and other visualizations | |
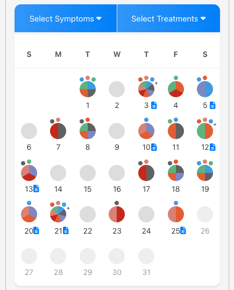
| Calendar |
Calendar of Symptoms and Treatments for the month.
Note: Requires the Visualization Coordinator. |
 |
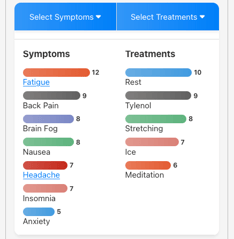
| Symptom / Treatment Histograms |
Histograms of Symptoms and Treatments for the month.
Note: Requires the Visualization Coordinator. |
 |
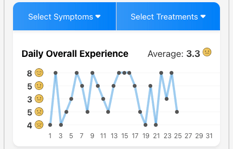
| Overall Experience Chart |
Chart of overall experience for the month.
Note: Requires the Visualization Coordinator. |
 |
| Report Builder | Allows a participant to build a custom PDF report of their Symptom Shark data. | 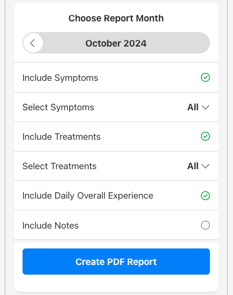 |
Glucose & Meals
| Component | Description | Example |
| Glucose Day Coordinator | Allows for paging through and selecting days while presenting summary infographics. | 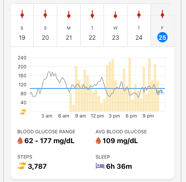 |
| Glucose Chart | A chart for visualizing glucose readings against steps, sleep, and meals. | |
| Meal Coordinator | Shares a self-reported meal log and selected meal across components. | N/A |
| Meal Log |
A simple self-reported meal log management component.
Note: Requires the Meal Coordinator. |
 |
| Meal Buttons |
A button panel used to add different types of meal log entries.
Note: Requires the Meal Coordinator. |
|
| Meal Editor | A simple self-reported meal log editor. | 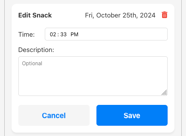 |
| Meal Analysis Preview | A component that displays pending meal analyses, allows for one-at-a-time review, and can open a full meal analysis review worklist. |  |
| Stress Level | A slider bar for recording daily stress levels. | 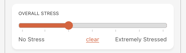 |
AI
| Component | Description | Example |
|
AI Assistant |
Interactive assistant that a participant can query to better understand their health data | 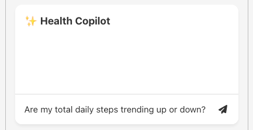 |
Deprecated
These components still work, but we encourage you to use newer components above that improve upon their functionality.
| Component | Description | Example |
| Relative Activity Today |
Displays today's activity relative to the participant's 30 day average
Recommended Component: Relative Activity, in the Data Visualization category |
 |